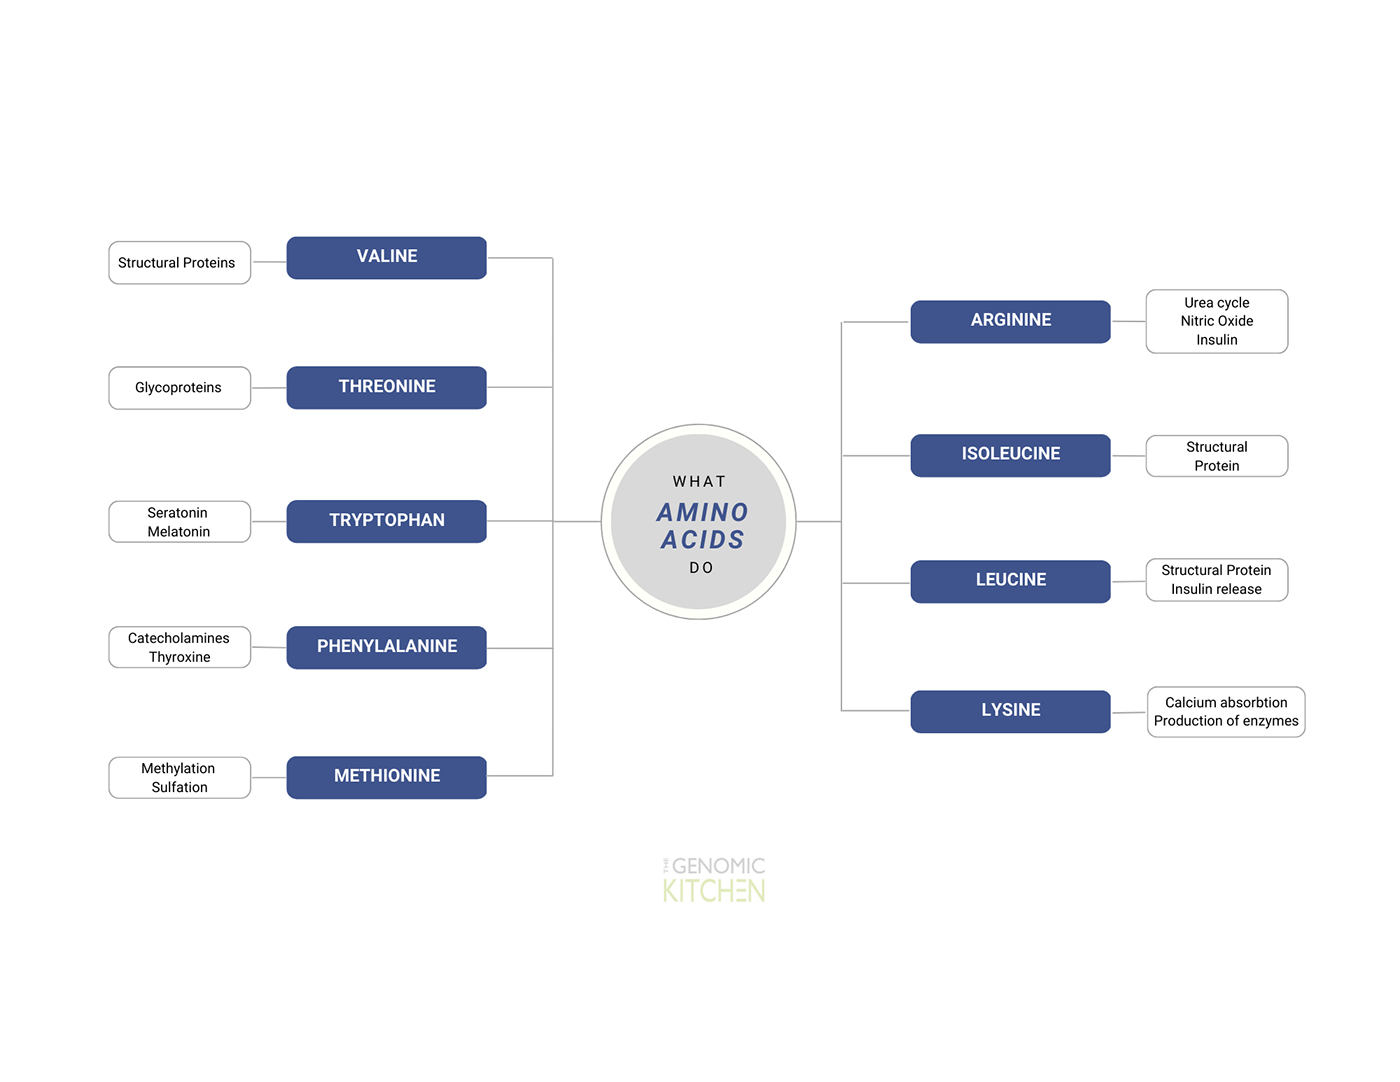
Infographic Design
Tell a visual story with an infographic

“Information is only useful when it can be understood.”
– Muriel Cooper

Infographics are an aesthetically pleasing way to summarize data and share information in a more compelling, engaging way with content consumers.
They can tell a story that captivates readers in a way words alone fail to accomplish.
And, for those concerned with infographics being a thing of the past, infographics have had the biggest increase in usage among B2B marketers in the last four years and was at 67% in 2020.

The mind processes information in pictures much faster than it does in words and humans tend to be visual creatures inherently.
If you are trying to understand something complicated, infographics help your brain work through it quicker.


Your organization can be best promoted when your content and visuals include useful and meaningful information for viewers. Increase your potential reach by publishing infographics that are:
1) Relevant to your audience.
2) Visually appealing.
3) Adhere to your brand guidelines.
4) Convey complex information in a simple format.
5) Tell a compelling story worthy of sharing.

Infographics should not only be easy to consume, but easy for readers to share.

Creating interesting and informative graphics can help people learn more about you or your business and be seen as a voice of authority.

In order for your content marketing strategy to be successful, it needs to align with your brand’s message and identity.
If someone sees an infographic on your site or on third-party sites or social platforms, they should be able to tell that it came from your company because of its unique design.

When done right, your target audience will be able to discern your brand’s infographics from others.
Customize every aspect of your infographic, from colors to fonts to text placement to align with your branding.
By doing so, you’ll build brand awareness and raise your credibility among your audience.

An infographic can help readers easily digest text-heavy content and makes the content easier to understand for visual learners.
As we become an increasingly visually focused society, as evidenced by the rise of social media platforms such as Instagram and TikTok that rely heavily on visuals, if we cannot scan through the text quickly, then the content isn’t leaving as much of an impact.


“I strive for two things in design: simplicity and clarity. Great design is born of those two things.”
– Lindon Leader


Want to sort out complex information and make it easy for your audience?
Reach out to me now: https://www.upwork.com/freelancers/~01369da8f138759ed1
You may also send me an email here: koyelmolla37@gmail.com
Let's help you organize your data into digestible and stunning visuals!


